Volume on the chart
The indicator, which was inherited from the standard Volume indicator, was created in this example. The OnCalculate method was redefined and left empty (to avoid unnecessary calculations). And outlined the rendering logic in the OnRender method. Colours are taken from the base indicator DataSeries.
[DisplayName("Volume on the chart")]
public class VolumeOnChart : Volume
{
private decimal _height = 15;
public decimal Height
{
get { return _height; }
set
{
if (value < 10 || value > 100)
return;
_height = value;
}
}
public VolumeOnChart()
{
EnableCustomDrawing = true;
}
protected override void OnCalculate(int bar, decimal value)
{
}
protected override void OnRender(RenderContext context,
DrawingLayouts layout)
{
var maxValue = 0m;
var maxHeight = ChartInfo.Region.Height * _height / 100m;
for (int i = FirstVisibleBarNumber; i <= LastVisibleBarNumber; i++)
{
var candle = GetCandle(i);
var volumeValue = Input == InputType.Volume ? candle.Volume : candle.Ticks;
maxValue = Math.Max(volumeValue, maxValue);
}
for (int i = FirstVisibleBarNumber; i <= LastVisibleBarNumber; i++)
{
var candle = GetCandle(i);
var volumeValue = Input == InputType.Volume ? candle.Volume : candle.Ticks;
Color volumeColor;
if (UseFilter && volumeValue > FilterValue)
{
volumeColor = filterColor;
}
else
{
if (DeltaColored)
{
if (candle.Delta > 0)
{
volumeColor = positiveColor;
}
else if (candle.Delta < 0)
{
volumeColor = negativeColor;
}
else
{
volumeColor = neutralColor;
}
}
else
{
if (candle.Close > candle.Open)
{
volumeColor = positiveColor;
}
else if (candle.Close < candle.Open)
{
volumeColor = negativeColor;
}
else
{
volumeColor = neutralColor;
}
}
}
var x = ChartInfo.GetXByBar(i);
var height = (int)(maxHeight * volumeValue / maxValue);
var rectangle =
new Rectangle(x, ChartInfo.Region.Height - height, (
int)ChartInfo.PriceChartContainer.BarsWidth, height);
context.FillRectangle(volumeColor, rectangle);
}
}
{
return "Volume on the chart";
}
}
Implementation of the IIndicatorDataProvider interface that provides access to various data and servi...
Definition IndicatorDataProvider.cs:123
const string CandlesPanel
Represents the name of the candles panel on the chart.
Definition IndicatorDataProvider.cs:140
Represents a data series of decimal values, each element is a decimal.
Definition ValueDataSeries.cs:26
Definition FeatureId.cs:2
DrawingLayouts
Enumerates the different drawing layouts available for chart drawings.
Definition DrawingLayouts.cs:14
@ Rectangle
Rectangle graphic object.
override string ToString()
Definition StopProfit.cs:94
Current price
Example of an indicator which displays the current price and current time in the chart:
[DisplayName("Current price")]
{
RenderFont _font = new RenderFont("Roboto", 14);
private Color _background = Color.Blue;
private Color _textColor = Color.AliceBlue;
private RenderStringFormat _stringFormat = new RenderStringFormat() { LineAlignment = StringAlignment.Center, Alignment = StringAlignment.Far };
public System.Windows.Media.Color Background
{
get => _background.Convert();
set => _background = value.Convert();
}
public System.Windows.Media.Color TextColor
{
get => _textColor.Convert();
set => _textColor = value.Convert();
}
public float FontSize
{
get => _font.Size;
set
{
if (value < 5)
return;
_font = new RenderFont("Roboto", value);
}
}
public bool ShowTime { get; set; } = true;
public string TimeFormat { get; set; } = "HH:mm:ss";
public CurrentPrice() : base(true)
{
EnableCustomDrawing = true;
DataSeries[0].IsHidden = true;
}
#region Overrides of BaseIndicator
protected override void OnCalculate(int bar, decimal value)
{
}
#endregion
protected override void OnRender(RenderContext context,
DrawingLayouts layout)
{
if (LastVisibleBarNumber != CurrentBar - 1)
return;
var candle = GetCandle(LastVisibleBarNumber);
var priceString = candle.Close.ToString();
var size = context.MeasureString(priceString, _font);
var x = (int)(ChartInfo.GetXByBar(LastVisibleBarNumber) + ChartInfo.PriceChartContainer.BarsWidth);
var y = ChartInfo.GetYByPrice(candle.Close, false);
var rectangle =
new Rectangle(x + 10, y - (
int)size.Height / 2, (
int)size.Width + 10, (
int)size.Height);
var points = new List<point>
{
new Point(x, y),
new Point(rectangle.X, rectangle.Y),
new Point(rectangle.X + rectangle.Width, rectangle.Y),
new Point(rectangle.X + rectangle.Width, rectangle.Y + rectangle.Height),
new Point(rectangle.X, rectangle.Y + rectangle.Height),
};
context.FillPolygon(_background, points.ToArray());
rectangle.Y++;
context.DrawString(priceString, _font, _textColor, rectangle, _stringFormat);
if (ShowTime)
{
var time =
DateTime.Now.ToString(TimeFormat);
size = context.MeasureString(time, _font);
context.DrawString(time, _font, _textColor, rectangle.X + rectangle.Width - size.Width, rectangle.Y - size.Height);
}
}
}
Base class for custom indicators.
Definition Indicator.cs:44
Current price
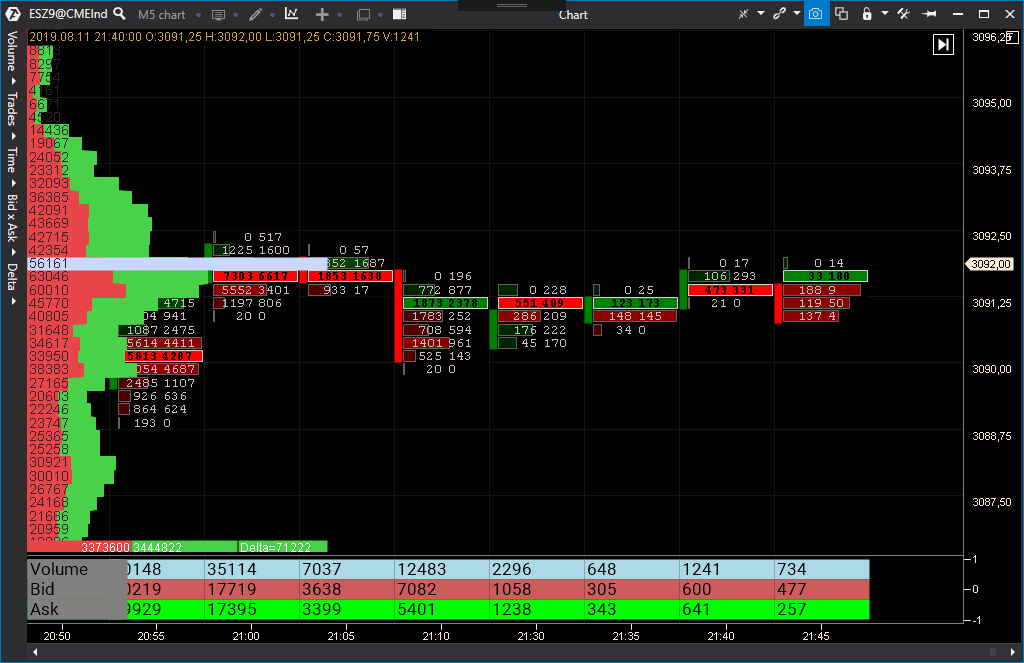
Tables
Below is an example of the indicator, which displays the data in the table form (Cluster Statistic analog)
public class ClusterStatisticSample :
Indicator
{
public ClusterStatisticSample()
{
EnableCustomDrawing = true;
DenyToChangePanel = true;
DataSeries[0].IsHidden = true;
}
protected override void OnCalculate(int bar, decimal value)
{
}
protected override void OnRender(RenderContext context,
DrawingLayouts layout)
{
var rowHeight = Container.Region.Height / 3;
var drawText = ChartInfo.PriceChartContainer.BarsWidth > 50;
var font = new RenderFont("Roboto", 13);
for (int bar = FirstVisibleBarNumber; bar <= LastVisibleBarNumber; bar++)
{
var candle = GetCandle(bar);
var x = ChartInfo.GetXByBar(bar);
rectangle =
new Rectangle(x, y, (
int)ChartInfo.PriceChartContainer.BarsWidth, rowHeight);
context.FillRectangle(Color.LightBlue, rectangle);
if (drawText)
context.DrawString(candle.Volume.ToString(), font, Color.Black, rectangle);
rectangle.Y += rowHeight;
context.FillRectangle(Color.IndianRed, rectangle);
if (drawText)
context.DrawString(candle.Bid.ToString(), font, Color.Black, rectangle);
rectangle.Y += rowHeight;
context.FillRectangle(Color.Lime, rectangle);
if (drawText)
context.DrawString(candle.Ask.ToString(), font, Color.Black, rectangle);
}
#region draw headers
context.FillRectangle(Color.Gray, rectangle);
context.DrawString("Volume", font, Color.Black, rectangle);
rectangle.Y += rowHeight;
context.FillRectangle(Color.Gray, rectangle);
context.DrawString("Bid", font, Color.Black, rectangle);
rectangle.Y += rowHeight;
context.FillRectangle(Color.Gray, rectangle);
context.DrawString("Ask", font, Color.Black, rectangle);
#endregion
}
}
Represents a container with a defined region on the chart.
Definition IIndicatorContainer.cs:596
Rectangle Region
Gets the region of the container.
Definition IIndicatorContainer.cs:600
const string NewPanel
Represents the name of a new panel.
Definition IndicatorDataProvider.cs:135
Tables
Watermark
Sample of indicator which shows watermark on the chart:
namespace ATAS.Indicators.Technical
{
using System;
using System.ComponentModel;
using System.ComponentModel.DataAnnotations;
using System.Drawing;
using ATAS.Indicators.Editors;
using ATAS.Indicators.Properties;
using OFT.Rendering.Context;
using OFT.Rendering.Tools;
using Color = System.Windows.Media.Color;
{
#region Nested types
public enum Location
{
[Display(Name = "Center")]
Center,
[Display(Name = "TopLeft")]
TopLeft,
[Display(Name = "TopRight")]
TopRight,
[Display(Name = "BottomLeft")]
BottomLeft,
[Display(Name = "BottomRight")]
BottomRight
}
#endregion
#region Properties
[Display(Name =
"Color", GroupName =
"Common",
Order = 10)]
public Color TextColor { get; set; } = Color.FromArgb(255, 225, 225, 225);
[Display(Name =
"TextLocation", GroupName =
"Common",
Order = 20)]
public Location TextLocation { get; set; }
[Display(Name =
"HorizontalOffset", GroupName =
"Common",
Order = 30)]
public int HorizontalOffset { get; set; }
[Display(Name =
"VerticalOffset", GroupName =
"Common",
Order = 40)]
public int VerticalOffset { get; set; }
[Display(Name =
"ShowInstrument", GroupName =
"FirstLine",
Order = 50)]
public bool ShowInstrument { get; set; } = true;
[Display(Name =
"ShowPeriod", GroupName =
"FirstLine",
Order = 60)]
public bool ShowPeriod { get; set; } = true;
[Display(Name =
"Font", GroupName =
"FirstLine",
Order = 70)]
[Editor(typeof(FontEditor), typeof(FontEditor))]
public FontSetting Font { get; set; } = new FontSetting { Size = 60, Bold = true };
[Display(Name =
"Text", GroupName =
"SecondLine",
Order = 80)]
public string AdditionalText { get; set; } = "";
[Display(Name =
"Font", GroupName =
"SecondLine",
Order = 90)]
[Editor(typeof(FontEditor), typeof(FontEditor))]
public FontSetting AdditionalFont { get; set; } = new FontSetting { Size = 55 };
[Display(Name =
"VerticalOffset", GroupName =
"SecondLine",
Order = 100)]
public int AdditionalTextYOffset { get; set; } = -40;
#endregion
#region ctor
public Watermark()
: base(true)
{
Font.PropertyChanged += (a, b) => RedrawChart();
AdditionalFont.PropertyChanged += (a, b) => RedrawChart();
DataSeries[0].IsHidden = true;
DenyToChangePanel = true;
EnableCustomDrawing = true;
DrawAbovePrice = false;
}
#endregion
#region Overrides of BaseIndicator
protected override void OnCalculate(int bar, decimal value)
{
}
protected override void OnRender(RenderContext context,
DrawingLayouts layout)
{
var showSecondLine = !string.IsNullOrWhiteSpace(AdditionalText);
if (!showSecondLine && !ShowInstrument && !ShowPeriod)
return;
var textColor = TextColor.Convert();
var additionalTextRectangle =
new Rectangle();
var firstLine = string.Empty;
if (showSecondLine && !string.IsNullOrEmpty(AdditionalText))
{
var size = context.MeasureString(AdditionalText, AdditionalFont.Font);
additionalTextRectangle =
new Rectangle(0, 0, (
int)size.Width, (
int)size.Height);
}
if (ShowInstrument || ShowPeriod)
{
if (ShowInstrument)
if (ShowPeriod)
{
var period = ChartInfo.ChartType == "TimeFrame" ? ChartInfo.TimeFrame : $"{ChartInfo.ChartType} {ChartInfo.TimeFrame}";
if (ShowInstrument)
firstLine += $", {period}";
else
firstLine += $"{period}";
}
var size = context.MeasureString(firstLine, Font.Font);
mainTextRectangle =
new Rectangle(0, 0, (
int)size.Width, (
int)size.Height);
}
if (mainTextRectangle.Height > 0 && additionalTextRectangle.Height > 0)
{
int firstLineX;
int secondLineX;
var y = 0;
var totalHeight = mainTextRectangle.Height + additionalTextRectangle.Height + AdditionalTextYOffset;
switch (TextLocation)
{
case Location.Center:
{
firstLineX = ChartInfo.PriceChartContainer.Region.Width / 2 - mainTextRectangle.Width / 2 + HorizontalOffset;
secondLineX = ChartInfo.PriceChartContainer.Region.Width / 2 - additionalTextRectangle.Width / 2 + HorizontalOffset;
y = ChartInfo.PriceChartContainer.Region.Height / 2 - totalHeight / 2 + VerticalOffset;
break;
}
case Location.TopLeft:
{
firstLineX = secondLineX = HorizontalOffset;
break;
}
case Location.TopRight:
{
firstLineX = ChartInfo.PriceChartContainer.Region.Width - mainTextRectangle.Width + HorizontalOffset;
secondLineX = ChartInfo.PriceChartContainer.Region.Width - additionalTextRectangle.Width + HorizontalOffset;
break;
}
case Location.BottomLeft:
{
firstLineX = secondLineX = HorizontalOffset;
y = ChartInfo.PriceChartContainer.Region.Height - totalHeight + VerticalOffset;
break;
}
case Location.BottomRight:
{
firstLineX = ChartInfo.PriceChartContainer.Region.Width - mainTextRectangle.Width + HorizontalOffset;
secondLineX = ChartInfo.PriceChartContainer.Region.Width - additionalTextRectangle.Width + HorizontalOffset;
y = ChartInfo.PriceChartContainer.Region.Height - totalHeight + VerticalOffset;
break;
}
default:
throw new ArgumentOutOfRangeException();
}
context.DrawString(firstLine, Font.Font, textColor, firstLineX, y);
context.DrawString(AdditionalText, AdditionalFont.Font, textColor, secondLineX, y + mainTextRectangle.Height + AdditionalTextYOffset);
}
else if (mainTextRectangle.Height > 0)
{
DrawString(context, firstLine, Font.Font, textColor, mainTextRectangle);
}
else if (additionalTextRectangle.Height > 0)
{
DrawString(context, AdditionalText, AdditionalFont.Font, textColor, additionalTextRectangle);
}
}
private void DrawString(RenderContext context, string text, RenderFont font, System.Drawing.Color color, Rectangle rectangle)
{
switch (TextLocation)
{
case Location.Center:
{
context.DrawString(text, font, color, ChartInfo.PriceChartContainer.Region.Width / 2 - rectangle.Width / 2 + HorizontalOffset,
ChartInfo.PriceChartContainer.Region.Height / 2 - rectangle.Height / 2 + VerticalOffset);
break;
}
case Location.TopLeft:
{
context.DrawString(text, font, color, HorizontalOffset, VerticalOffset);
break;
}
case Location.TopRight:
{
context.DrawString(text, font, color, ChartInfo.PriceChartContainer.Region.Width - rectangle.Width + HorizontalOffset, VerticalOffset);
break;
}
case Location.BottomLeft:
{
context.DrawString(text, font, color, HorizontalOffset, ChartInfo.PriceChartContainer.Region.Height - rectangle.Height + VerticalOffset);
break;
}
case Location.BottomRight:
{
context.DrawString(text, font, color, ChartInfo.PriceChartContainer.Region.Width - rectangle.Width + HorizontalOffset,
ChartInfo.PriceChartContainer.Region.Height - rectangle.Height + VerticalOffset);
break;
}
default:
throw new ArgumentOutOfRangeException();
}
}
#endregion
}
}
Represents an order for trading on a financial exchange.
Definition Order.cs:13
Implementation of the IInstrumentInfo interface representing instrument information.
Definition InstrumentInfo.cs:33
string Instrument
Gets the name of the instrument.
Definition InstrumentInfo.cs:35

Watermark
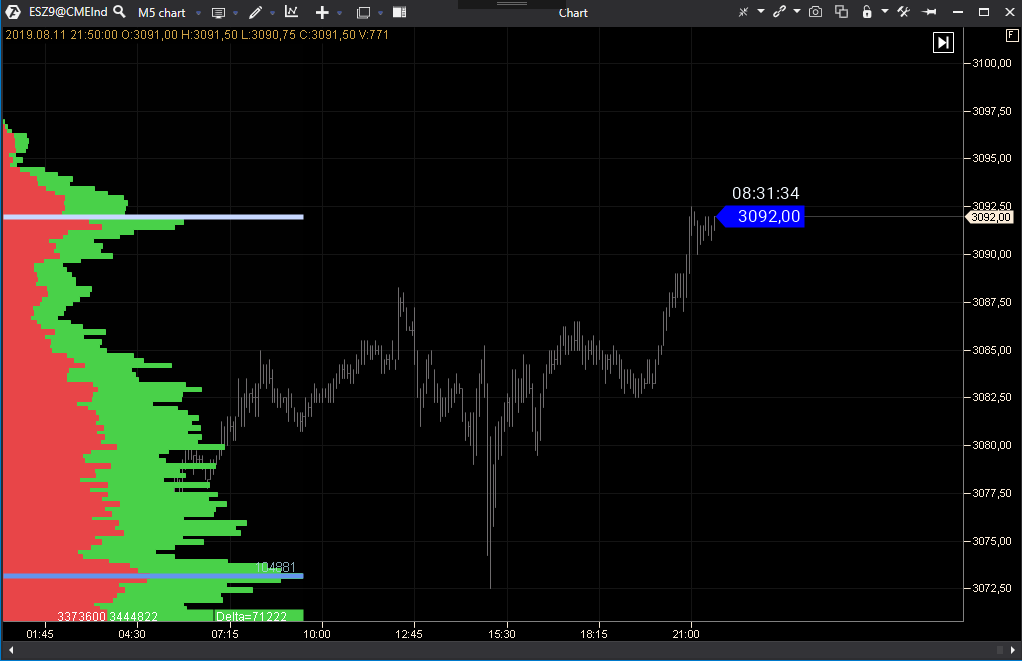
Maximum Levels
namespace ATAS.Indicators.Technical
{
using System;
using System.ComponentModel;
using System.ComponentModel.DataAnnotations;
using System.Drawing;
using ATAS.Indicators.Properties;
using OFT.Rendering.Context;
using OFT.Rendering.Tools;
using Utils.Common.Attributes;
using Utils.Common.Localization;
[DisplayName("Maximum Levels")]
[Category("Clusters, Profiles, Levels")]
{
#region Nested types
public enum MaxLevelType
{
Bid,
Ask,
PositiveDelta,
NegativeDelta,
Volume,
Tick,
Time
};
#endregion
#region Private
private RenderStringFormat _stringRightFormat = new RenderStringFormat
{
Alignment = StringAlignment.Far,
LineAlignment = StringAlignment.Center,
Trimming = StringTrimming.EllipsisCharacter,
FormatFlags = StringFormatFlags.NoWrap
};
private bool _candleRequested;
private Color _lineColor = System.Drawing.Color.CornflowerBlue;
private Color _axisTextColor = System.Drawing.Color.White;
private Color _textColor = System.Drawing.Color.Black;
private RenderPen _renderPen = new RenderPen(System.Drawing.Color.CornflowerBlue, 2);
private int _width = 2;
private RenderFont _font = new RenderFont("Arial", 8);
private string _description = "Current Day";
#endregion
#region Properties
{
get => _period;
set
{
_period = value;
_description = GetPeriodDescription(_period);
RecalculateValues();
}
}
public MaxLevelType Type { get; set; } = MaxLevelType.Volume;
public System.Windows.Media.Color Color
{
get => _lineColor.Convert();
set
{
_lineColor = value.Convert();
_renderPen = new RenderPen(_lineColor, _width);
}
}
public int Width
{
get => _width;
set
{
_width = Math.Max(1, value);
_renderPen = new RenderPen(_lineColor, _width);
}
}
public System.Windows.Media.Color AxisTextColor
{
get => _axisTextColor.Convert();
set => _axisTextColor = value.Convert();
}
public bool ShowText { get; set; } = true;
public System.Windows.Media.Color TextColor
{
get => _textColor.Convert();
set => _textColor = value.Convert();
}
public int FontSize
{
get => (int)_font.Size;
set => _font = new RenderFont("Arial", Math.Max(7, value));
}
#endregion
public MaxLevels()
: base(true)
{
DataSeries[0].IsHidden = true;
DenyToChangePanel = true;
EnableCustomDrawing = true;
DrawAbovePrice = true;
Width = Width;
}
#region Overrides of BaseIndicator
protected override void OnCalculate(int bar, decimal value)
{
if (bar == 0)
_candleRequested = false;
if (!_candleRequested && bar == CurrentBar - 1)
{
_candleRequested = true;
}
}
{
_candle = fixedProfile;
RedrawChart();
}
protected override void OnRender(RenderContext context,
DrawingLayouts layout)
{
if (_candle == null)
return;
var priceInfo = GetPriceVolumeInfo(_candle, Type);
if (priceInfo == null)
return;
var y = ChartInfo.GetYByPrice(priceInfo.Price);
var firstX = ChartInfo.PriceChartContainer.Region.Width / 2;
var secondX = ChartInfo.PriceChartContainer.Region.Width;
context.DrawLine(_renderPen, firstX, y, secondX, y);
if (ShowText)
{
var size = context.MeasureString(_description, _font);
var textRect =
new Rectangle(
new Point(ChartInfo.PriceChartContainer.Region.Width - (
int)size.Width - 20, y - (
int)size.Height - Width / 2),
new Size((int)size.Width + 20, (int)size.Height));
context.DrawString(_description, _font, _textColor, textRect, _stringRightFormat);
}
this.DrawLabelOnPriceAxis(context, string.Format(ChartInfo.StringFormat, priceInfo.Price), y, _font, _lineColor, _axisTextColor);
}
#endregion
{
switch (period)
{
return "Current Day";
return "Last Day";
return "Current Week";
return "Last Week";
return "Current Month";
return "Last Month";
return "Contract";
default:
throw new ArgumentOutOfRangeException(nameof(period), period, null);
}
}
{
switch (Type)
{
{
}
{
}
case MaxLevelType.PositiveDelta:
{
}
case MaxLevelType.NegativeDelta:
{
}
{
}
case MaxLevelType.Tick:
{
}
{
}
default:
throw new ArgumentOutOfRangeException();
}
}
}
}
Represents a request for a fixed profile with a specific period.
Definition PriceVolumeInfo.cs:289
Represents an Indicator Candle.
Definition IndicatorCandle.cs:10
PriceVolumeInfo MaxPositiveDeltaPriceInfo
Gets the PriceVolumeInfo object with the maximum positive delta.
Definition IndicatorCandle.cs:161
PriceVolumeInfo MaxAskPriceInfo
Gets the PriceVolumeInfo object with the maximum ask price.
Definition IndicatorCandle.cs:151
PriceVolumeInfo MaxVolumePriceInfo
Gets the PriceVolumeInfo object with the maximum volume.
Definition IndicatorCandle.cs:145
PriceVolumeInfo MaxTickPriceInfo
Gets the PriceVolumeInfo object with the maximum tick count.
Definition IndicatorCandle.cs:148
PriceVolumeInfo MaxTimePriceInfo
Gets the PriceVolumeInfo object with the maximum time.
Definition IndicatorCandle.cs:158
PriceVolumeInfo MaxBidPriceInfo
Gets the PriceVolumeInfo object with the maximum bid price.
Definition IndicatorCandle.cs:154
PriceVolumeInfo MaxNegativeDeltaPriceInfo
Gets the PriceVolumeInfo object with the maximum negative delta.
Definition IndicatorCandle.cs:164
Represents information on volumes at a specific price.
Definition PriceVolumeInfo.cs:14
decimal Ask
Gets or sets the ask data.
Definition PriceVolumeInfo.cs:28
decimal Bid
Gets or sets the bid data.
Definition PriceVolumeInfo.cs:23
decimal Volume
Gets or sets the volume data.
Definition PriceVolumeInfo.cs:18
int Time
Gets or sets the time data at the current level.
Definition PriceVolumeInfo.cs:43
FixedProfilePeriods
Enumeration representing fixed profile periods.
Definition PriceVolumeInfo.cs:241