A good helper in the development of indicators is the debug mode. Here we will talk about attaching to the running process of the ATAS platform using the Visual Studio debugger.
While working in this mode, the developer can step through the code sequentially, analyze the data stored in variables, set variable monitoring to track changes, determine where exceptions occur, and so on.
Before using this mode, you should learn more about its principles of operation here.
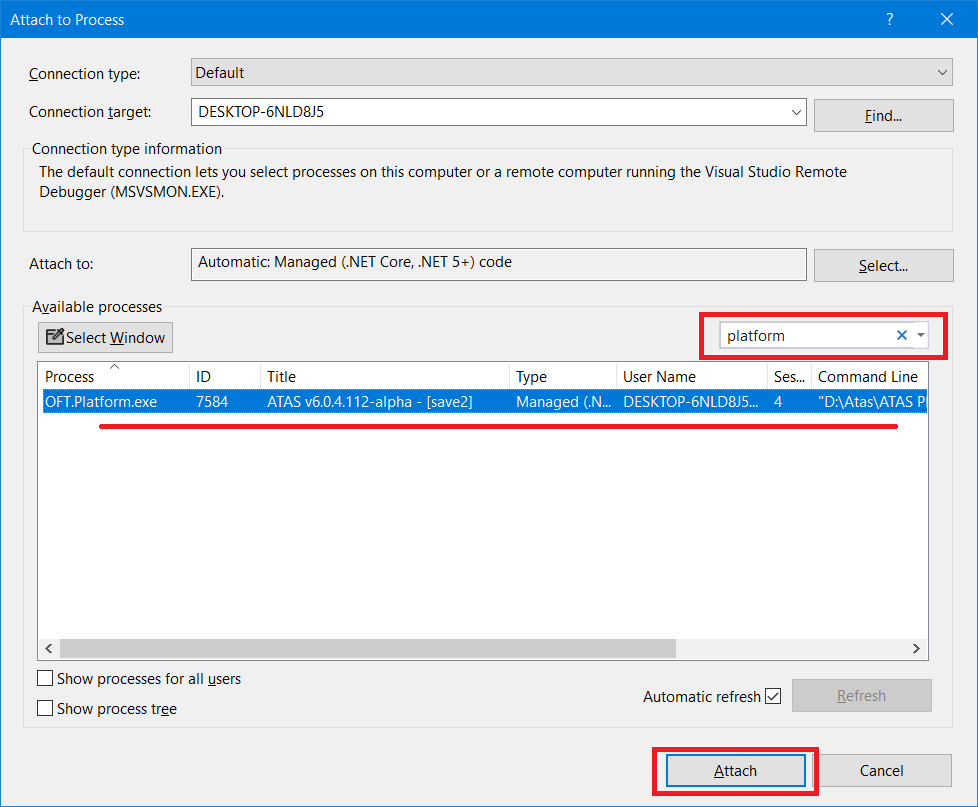
To attach the process, you need to do the following steps:
APPDATA%\ATAS\Indicators folder,CTRL + ALT + P,
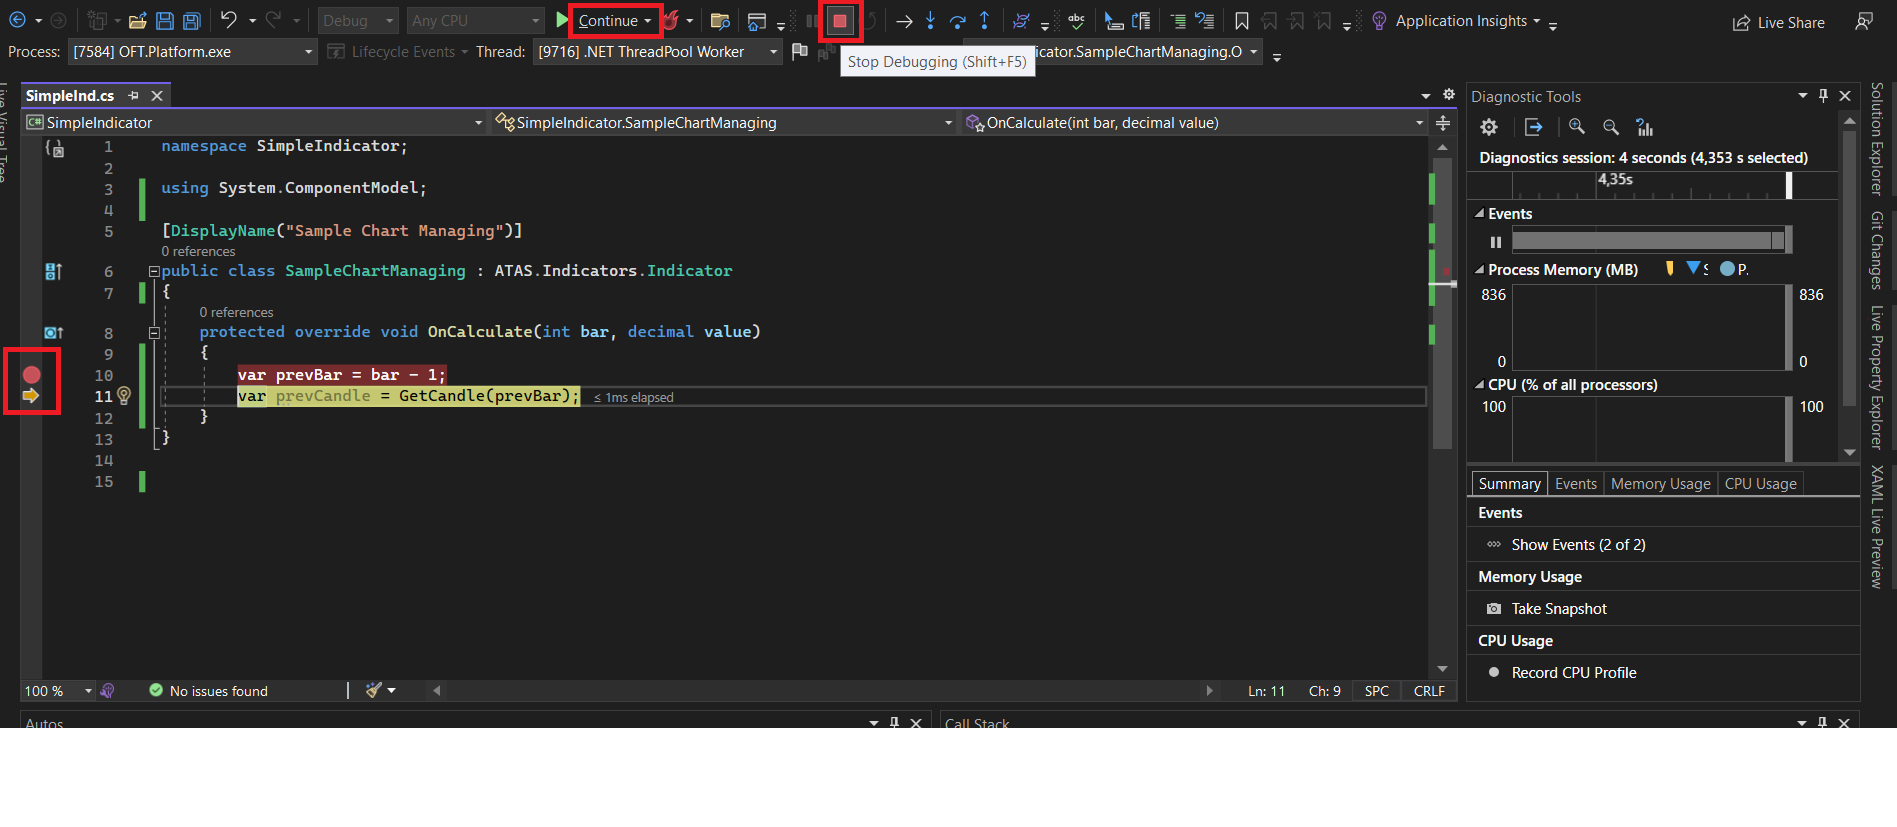
Using such a debugger tool as a breakpoint, you can pause the execution of the process at the desired line of code. Using the F10 and F11 keys, you can go through the code line by line and track the path of the process, while finding out the values in the variables.
F11 (Step Into) - move through the lines of code, entering methods.
F10 (Step Over) - move through lines of code without going into methods.
If you need to continue the process - you need to click on the Continue button, in this case the process will continue to the next breakpoint. If for some time you no longer need to stop the process, you need to remove the breakpoints by clicking on them again. To exit debug mode, press the Stop button.

You can find the appearance of errors in the platform log window. Errors throw Exceptions during code execution.
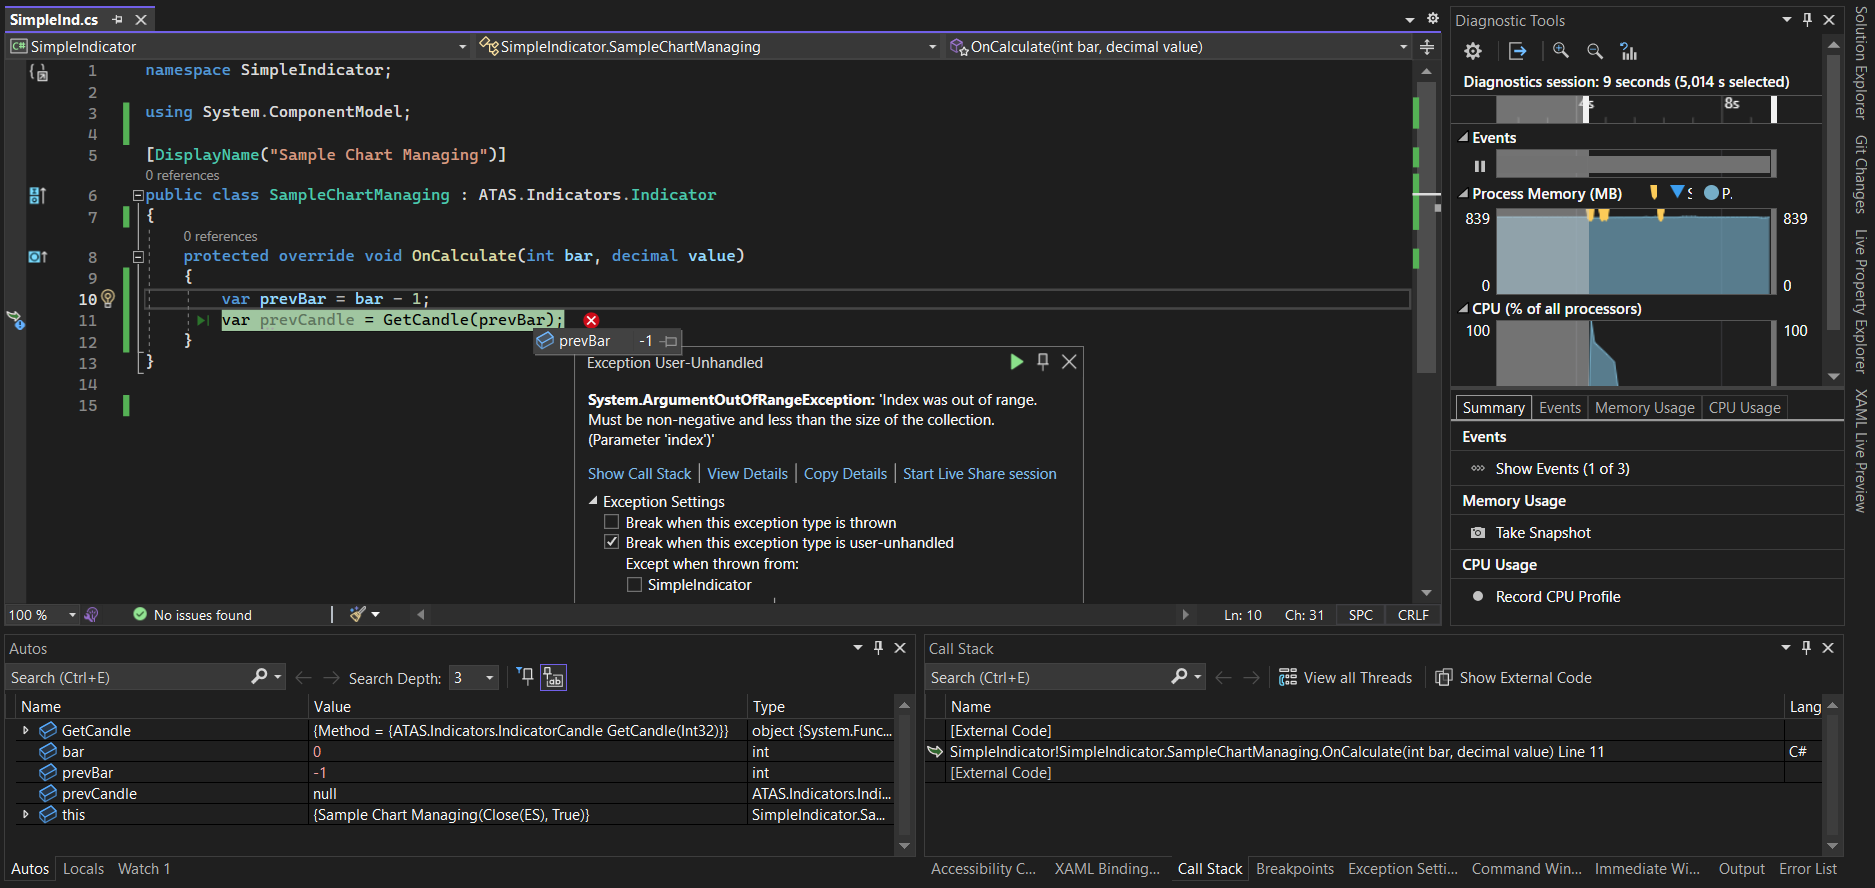
Having found an exception in the debugger, you can find out the reason for this exception, perhaps values in some variables are invalid for calculation.
A few tips for troubleshooting:
In the screenshot below, you can see an example of throwing an exception when we try to call the GetCandle method and pass a negative value to the parameters. By hovering over a variable, you can see its current value. In this case, the cursor is hovering over the prevBar variable, and you can see in the tooltip that it has a value of -1.
